


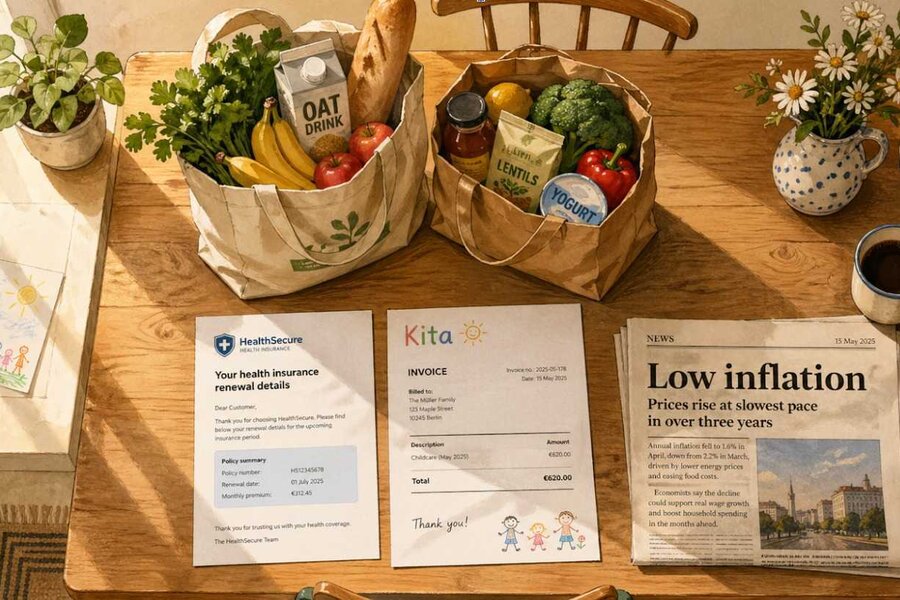
What does "0.2% inflation" actually mean?
Switzerland's inflation rate is measured by the Consumer Price Index, or CPI. Every month, the Federal Statistical Office tracks the prices of roughly 1,050 goods and services, from groceries and electricity to haircuts and train tickets. These items are weighted according to their share of the average household budget, updated annually based on a survey of around 3,000 households.[1] The result is a single number that tells you how much consumer prices have changed, on average, compared to the same month a year ago.
The CPI is a technically sound index, built to international standards and updated annually. It does what it was designed to do: give the Swiss National Bank a broad, standardised measure of consumer price changes for monetary policy.
But here is something important that often gets lost: the CPI was never designed to be a cost-of-living index. The FSO itself makes this distinction. A cost-of-living index would try to answer a broader question: how much does a household need to spend to maintain the same standard of living as before? That would mean accounting for taxes, mandatory insurance, housing costs for owners, and the ways people adjust their spending when prices change. Those are all difficult to measure consistently and vary enormously between households. The CPI answers a narrower question: how have the prices of a defined basket of consumer goods and services changed? When a headline says "inflation is 0.2%," most of us interpret it as "my costs went up 0.2%." That interpretation is where the gap begins.
Where the CPI and your household budget diverge
The CPI covers a lot. But several of the costs that weigh most heavily on household budgets are either excluded from the index, underrepresented in it, or assigned to a different category entirely: not price inflation, but affordability pressure. Understanding which is which matters.
Health insurance premiums: excluded from CPI
This is the clearest example of the gap. Compulsory health insurance premiums are not included in the Swiss CPI. The reason is methodological: in the framework the CPI is built on, premiums are treated as financing the healthcare system rather than buying a specific service that month.[2] You pay the insurer; the insurer pays for your care. The CPI does track the prices of medical services, medicines, and hospital stays, but not the premium itself.
That logic is internally consistent. But it means the headline inflation number excludes one of the largest and fastest-growing items in most household budgets. The FSO publishes a separate Health Insurance Premium Index, but it does not feed into the CPI. A 2025 paper by an FSO researcher, presented to the UNECE, compared a household cost approach (which includes mandatory premiums) with the CPI's standard approach: the household cost measure showed an 18.5% increase in insurance costs between December 2016 and November 2024, while the CPI's approach showed a 3.7% decrease over the same period.[3]
In plain terms: a measure that includes what you actually pay each month went up by nearly a fifth over eight years. The CPI, which excludes your premium, went slightly down for the same category. Two very different stories about the same household expense.
Premium increases have stayed sharp for several years running: +6.6% in 2023, +8.7% in 2024, +6% in 2025, and an officially announced +4.4% for 2026.[4] Increases are easing from the 2024 peak, but they remain well above headline inflation. For a family of four in a higher-premium canton like Zurich, health insurance can cost CHF 1,400 to 1,600 per month before subsidies (the national average is lower, around CHF 1,200). Either way, total healthcare-related spending typically represents around 10% of gross household income. The UBS Worry Barometer consistently ranks healthcare costs as the top concern of Swiss residents. Yet this entire cost category is invisible in the headline inflation number.
Property prices: an affordability gap, not an inflation gap
The CPI tracks rents, not property purchase prices. Rents are partially regulated through the reference interest rate, a benchmark published quarterly by the Federal Office for Housing based on the average mortgage rate of Swiss banks. It determines how much landlords can adjust rents when borrowing costs change. This means rents move slowly and predictably, which is a reasonable design for a consumer price index, since renting is how most Swiss households access housing (the homeownership rate is roughly 36%).
For anyone trying to buy, the picture looks very different. Swiss property prices have risen roughly 30% since 2017.[5] In Zurich, only 9% of couples aged 30 to 40 can now afford an average single-family home. The causes are multiple: land scarcity, zoning restrictions, immigration-driven demand, and down-payment rules that require 20% equity plus the ability to service the mortgage at a theoretical 5% stress-test rate. This is not a story about inflation in the CPI sense. It is a story about affordability, driven by structural forces that go beyond consumer prices. But for a generation watching homeownership slip out of reach while the headline number says "almost zero," the disconnect is deeply felt.
Childcare: high cost, low visibility in the basket
The CPI basket reflects average spending across all households, including the majority who do not have young children in paid care. For families who do, childcare is one of their largest expenses, but its weight in the CPI is tiny. In cities like Zurich, a full-time Kita place costs CHF 2,500 to 3,000 per month per child.[6] Switzerland has among the most expensive childcare in the OECD, with net costs for a two-earner couple reaching roughly 35% of average earnings. Public spending on early childhood services is well below the OECD average, and parents shoulder a far larger share of total costs than in countries like Germany and France. There is also a structural gap of nearly four years between the end of paid maternity leave (14 weeks) and the start of free compulsory education.[7]
The financial burden is compounded by an emotional one. Many parents, particularly mothers, face an impossible calculation: childcare costs can consume most of a second salary, making work barely worthwhile in the short term. But leaving the workforce risks lasting damage to earnings and career progression. The OECD has flagged this directly, noting that Swiss tax, benefit, and childcare systems create "strong disincentives to work for second earners, notably mothers."[8] A new federal law passed in December 2025 (UKibeG) introduces a childcare allowance of at least CHF 100 per month for families using one day of institutional care per week, plus CHF 50 for each additional half day. It is a step forward, but still a fraction of the actual cost.
Why the headline CPI is still so low
If these major household costs are rising or persistently high, why does the CPI show almost no inflation? Part of the answer is that several large CPI categories are currently falling, and they carry enough weight to pull the average down.
As of early 2026, transport prices were down roughly 2% year-on-year, food was down 0.5%, clothing and footwear down 1.2%, and household goods down 1.3%. Together, these categories represent about 29% of the CPI basket.[9] The primary reason is the strength of the Swiss franc. Oil is traded in US dollars, and a stronger franc makes fuel cheaper in CHF, pushing petrol prices to a four-year low.[10] Cars, clothing, electronics, and many food products are imported and priced in euros. A stronger franc means lower prices for all of them.
These are genuine savings, not statistical illusions. If you bought a new jacket or a television last year, you likely paid less than you would have two years ago.
But these savings are unevenly distributed. They help when you're shopping for consumer goods. They do not offset your health insurance premium increase, your Kita invoice, or your electricity bill (which has risen roughly 33% cumulatively since 2022, even though 2025 saw some tariff easing).[11] The costs that are rising tend to be domestic, service-based, and hard to avoid. The costs that are falling tend to be imported, goods-based, and discretionary. That imbalance is what creates the gap between the headline and the household.
When your lunch tells a different story
None of the following are scientific alternatives to the CPI. But they capture something the headline misses: the cost of local labour and local rent, passed through to the price of everyday services.
The Big Mac Index, published by The Economist, puts Switzerland's Big Mac at CHF 7.20 as of mid-2025, the most expensive in the world. That price has risen roughly 14% since 2021, about double the cumulative CPI over the same period.[12] The index was designed for currency valuation, not inflation measurement, but it captures something real: the cost of producing and selling a standardised product using local inputs.
The Comparis consumer price index, developed with KOF at ETH Zurich, tracks perceived inflation using a different methodology. It has shown sharper increases in domestically produced services, for example, electricity at +17.8% year-on-year in October 2024.[13]
And then there are your own receipts: the bakery bill, the burrito, the pub beer that has climbed from CHF 5 to closer to CHF 8 in Zurich over the past 15 years. Not scientific, but hard to argue with.
What does inflation actually look like for a family of four?
Rather than arguing in the abstract, let's build an illustrative scenario. Consider a family of four in Zurich: two working parents, two children under six, renting an apartment, and both children in Kita three days per week. Here is a rough breakdown of their monthly budget, how each category has been moving, and the resulting impact on their personal inflation rate:
| Category | Monthly CHF | Budget share | Annual change | Contribution |
|---|---|---|---|---|
| Rent | 2,800 | 28% | +1.5% | +0.42% |
| Health insurance | 1,500 | 15% | +7% | +1.05% |
| Childcare (2 kids) | 3,200 | 32% | +1% | +0.32% |
| Food & groceries | 1,200 | 12% | -0.5% | -0.06% |
| Transport | 400 | 4% | -2% | -0.08% |
| Electricity & heating | 225 | 2% | +5% | +0.10% |
| Other | 500 | 5% | 0% | 0.00% |
| Total / personal inflation | ~9,825 | ~100% | +1.75% |
Note: figures are approximate and based on typical costs in Zurich. Individual circumstances will vary. Childcare annual change reflects modest fee increases; the dominant cost factor is persistently high baseline spending. "Other" includes clothing, telecom, household goods, and supplementary insurance.
Even with conservative assumptions, this family's personal inflation rate comes out around 1.75%, nearly nine times the official CPI. If health insurance premiums were closer to the 8.7% increase seen in 2024, the figure would be higher still. The main driver is clear: health insurance alone contributes more than one full percentage point, and it does not appear in headline CPI at all.
This is a specific profile, not a universal claim. A retired couple, a single person without children, or a household with employer-subsidised insurance would have a very different experience. That is exactly the point: the CPI is an average across all households, and averages can mask very different individual realities.
It is also worth noting what helps. The statutory minimum child allowance is CHF 215 per month (CHF 268 for children in education), with some cantons paying more. Premium reductions support lower-income households, and regulated rents provide stability against market swings. The pressure tends to be most acute for families in the middle: earning too much to qualify for generous support, but not enough to buy property in the cities where they work.
Understanding the gap is the first step
The CPI is not misleading. Your experience is not wrong. They are answering different questions. The CPI tracks a broad basket of consumer prices. Your household budget tracks the specific costs you actually face. For many families, those two numbers have been drifting apart, and understanding why is the first step to making better financial decisions.
A few practical starting points: track your actual spending over time and work out your own personal inflation rate. (The FSO itself offers an individual inflation calculator on its website.[14]) Review your health insurance model every year: switching to a higher deductible, a telmed model, or an HMO plan can meaningfully reduce premiums. Check whether you qualify for premium reductions or childcare subsidies; many eligible families never apply. And budget for the costs that actually affect your household, not the official rate.
There is a connection to saving, too. If your personal inflation rate is closer to 2% than to 0.2%, and your savings account pays 0.5%, the gap between what you earn on savings and what your life actually costs is wider than the published figure suggests. We explored this in more detail in our earlier article, "Why Your Savings Account Is Losing You Money". Understanding that gap and planning around it is one of the most practical things you can do for your financial future.
Create your urble savings plan today:


- [1] Swiss Federal Statistical Office, Consumer Price Index methodology. The CPI tracks approximately 1,050 goods and services, weighted by average household spending from the Household Budget Survey (~3,000 households). Weights are updated annually.
- [2] Swiss Federal Statistical Office, CPI methodology documentation. Health insurance premiums are classified as transfer payments under the national accounts framework used for CPI construction. The FSO publishes a separate Health Insurance Premium Index (HIPI).
- [3] Privet, S. (2025), "A comprehensive analysis of household costs indices and their relevance for Switzerland," paper presented to the UNECE Group of Experts on Consumer Price Indices, Geneva. Compares HCI insurance index (+18.5%) with CPI insurance index (-3.7%) over December 2016 to November 2024. Over a longer horizon, KOF Swiss Economic Institute at ETH Zurich (2022) found mandatory premiums rose 125.7% from 1999 to 2021, while the CPI healthcare component barely moved over the same period.
- [4] Swiss Federal Office of Public Health (FOPH), annual premium announcements: +6.6% (2023), +8.7% (2024), +6% (2025), +4.4% officially announced for 2026.
- [5] Zürcher Kantonalbank / swissinfo.ch: Swiss property prices +30% since 2017. Only 9% of couples aged 30-40 in canton Zurich can afford an average single-family home (2024).
- [6] Summit Education / littlestar.ch analysis of 80 private Kitas in Zurich. Average daily rates: CHF 149 (infants under 18 months), CHF 131 (older children). Full-time monthly costs: CHF 2,751-3,129.
- [7] OECD Family Database (PF3.4) and OECD Education at a Glance 2024. Net childcare costs for a two-earner couple in Switzerland: ~35% of average earnings, among the highest in the OECD. Switzerland has a 4-year gap between the end of paid maternity leave and free compulsory education.
- [8] OECD Economic Surveys: Switzerland 2024. "The interplay between the tax and benefit systems and high costs of childcare result in strong disincentives to work for second earners, notably mothers." UKibeG (passed 19 December 2025): at least CHF 100/month for one institutional care day per week, plus CHF 50 per additional half day. Source: BSV.
- [9] Trading Economics / Swiss Federal Statistical Office, CPI by category, early 2026 data (ranges across January-March). Transport: -0.8% to -2%, food: -0.3% to -0.5%, clothing: -0.7% to -1.6%, household goods: -1.3%.
- [10] Touring Club Switzerland (TCS), June 2025. Petrol at CHF 1.68/litre, 4-year low. Drivers: OPEC production increase, USD weakness against CHF, lower Rhine freight rates.
- [11] Le News / ElCom, September 2025. Average 2026 electricity tariff: 27.7 centimes per kWh, a third higher than 2022 (21 centimes per kWh). Note: 2025 saw some tariff easing from the 2024 peak.
- [12] The Economist, Big Mac Index (July 2025). Swiss Big Mac at CHF 7.20 ($7.99), the most expensive globally. Note: the index was designed for currency valuation, not inflation measurement.
- [13] Comparis / KOF Swiss Economic Institute, ETH Zurich. Comparis consumer price index tracks perceived inflation using a methodology distinct from the official CPI.
- [14] The FSO offers a personal inflation calculator at bfs.admin.ch (Special page: Prices). It allows users to adjust CPI category weights to match their own spending patterns.